If this editor looks unfamiliar, you're likely using the previous version.
Access the right documentation by clicking on the button.
Analytics gathers all data from all of the leads that have seen your demo and provide you with a summary of those results.
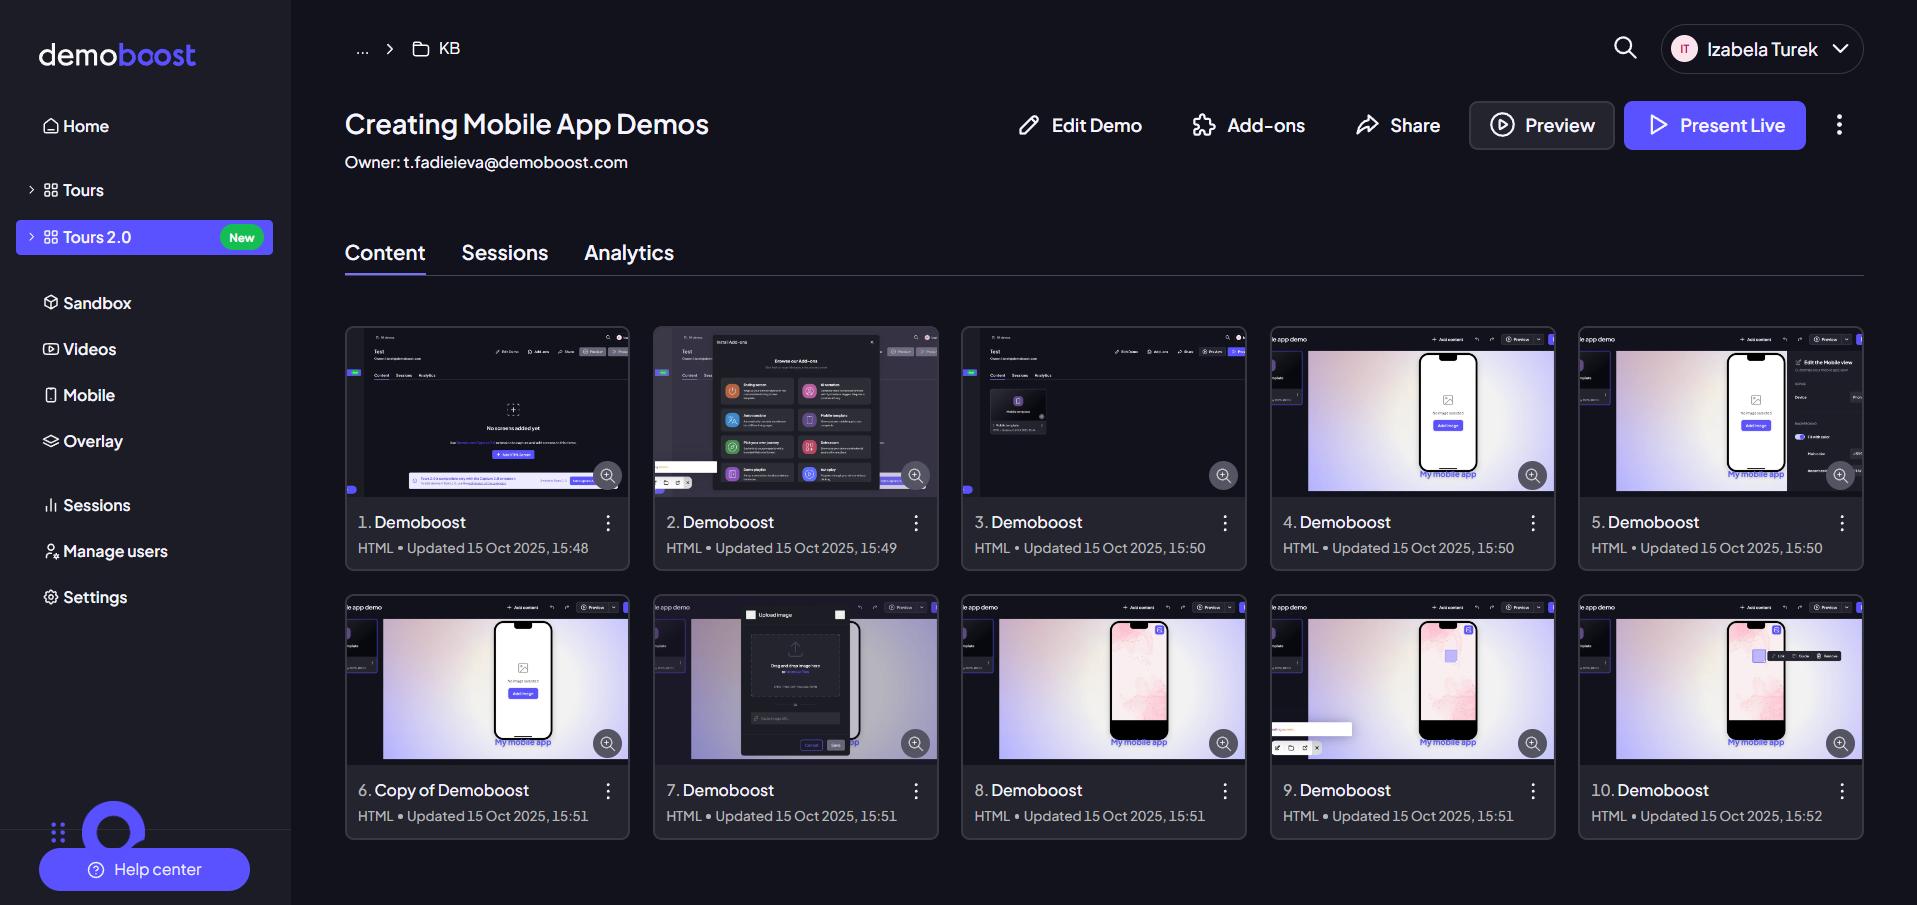
In order to access analytics, choose the demo you would like to analyze, and click “Analytics” tab:
The Analytics Overview is your command center for understanding demo performance. This feature gathers comprehensive data from every lead who interacts with your content, providing a clear, actionable one-page summary of the results. By focusing on key metrics and individual session details, you can continuously refine your strategy to boost engagement and improve conversion rates.
Effortlessly kickstart your journey with our beginner-friendly guides!
Step 1: You have two primary ways to access the performance data you need:
Per-Demo Analytics: To view the results for a specific demo, navigate to the Demo Details screen for that particular asset. From here, click the 'Analytics' tab. This tab provides the one-pager summary and graphs exclusive to that demo's performance.
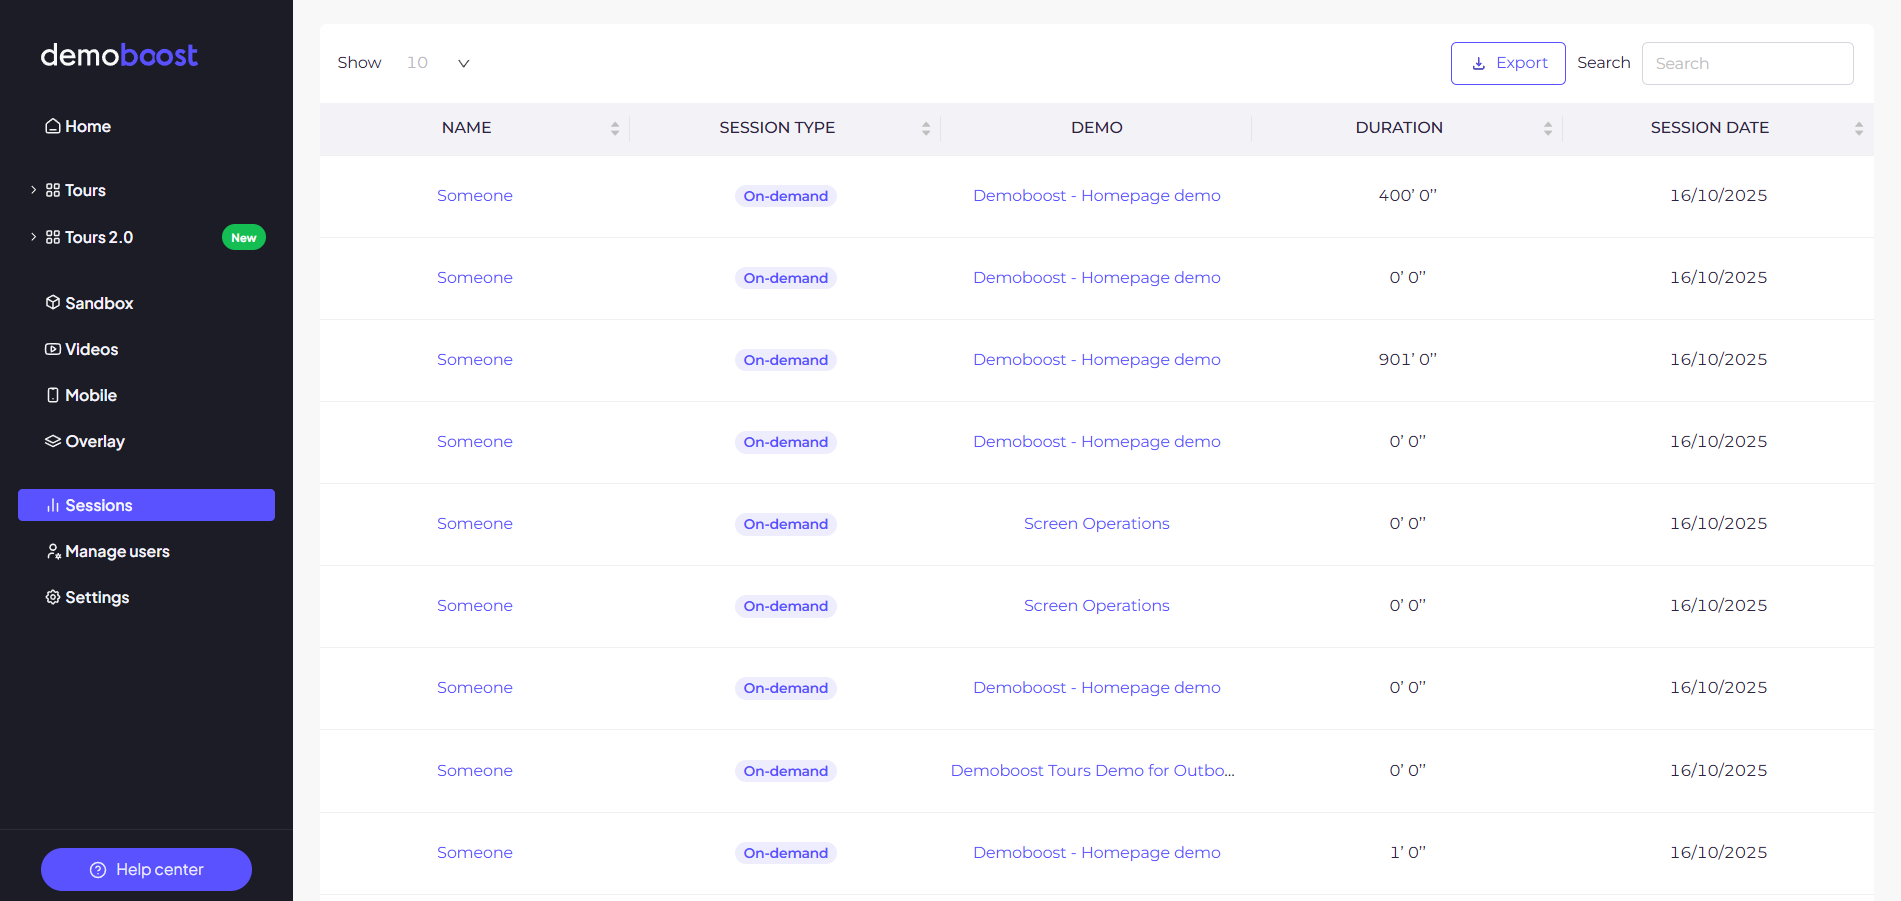
Global Sessions Data: To view a complete list of all individual viewing events across all your demos, navigate to the dedicated Sessions section, which is typically found in the main left-hand menu.
Step 2: The Analytics Overview screen often presents five crucial metrics as a high-level summary. These statistics give you an immediate understanding of your demo's effectiveness:
Sessions The total number of individual times the demo was started or viewed. Measures overall reach and usage.
Avg. Demo Rating The average score (1-5) left by users in the feedback form after viewing an on-demand session. Reflects user satisfaction and quality perception.
Avg. NPS The average Net Promoter Score (1-10) derived from the feedback question: "How likely are you to recommend this product to others." Indicates customer loyalty and advocacy potential.
Demo Completion Rate The average percentage of the demo that users navigated through before stopping. Gauges content engagement and identifies drop-off points.
Engagement Score The average Session Score, which is an internal measure of how actively engaged a person was with your demo content. Provides a qualitative measure of prospect interest.
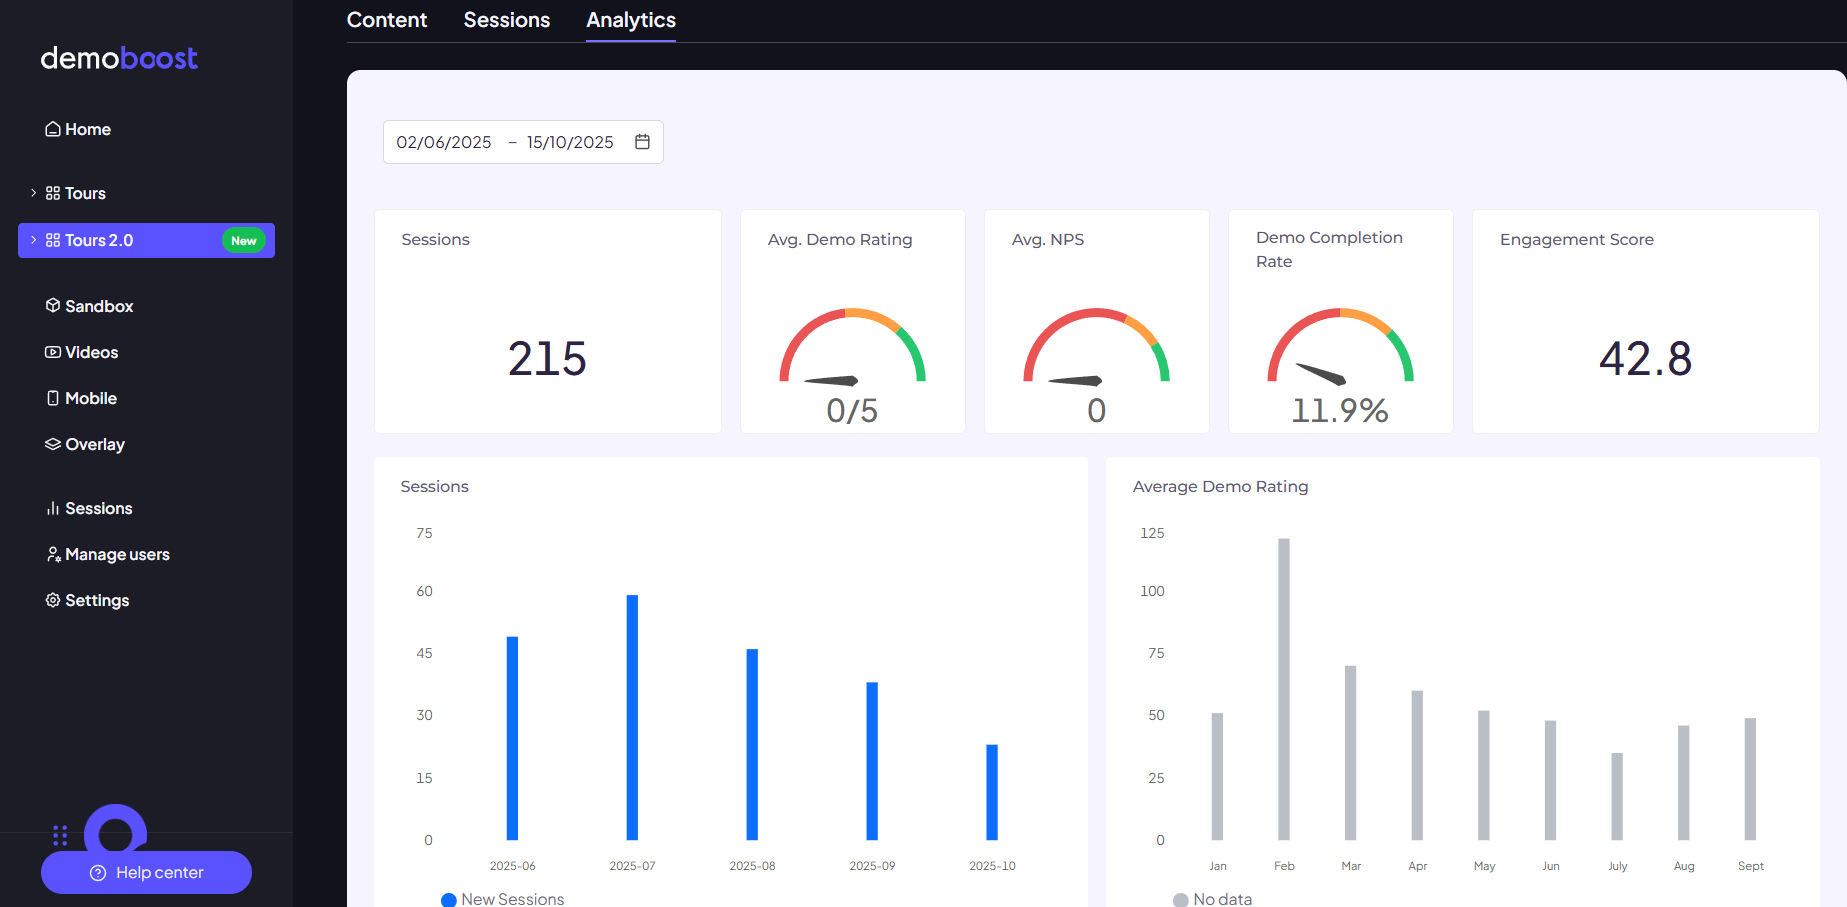
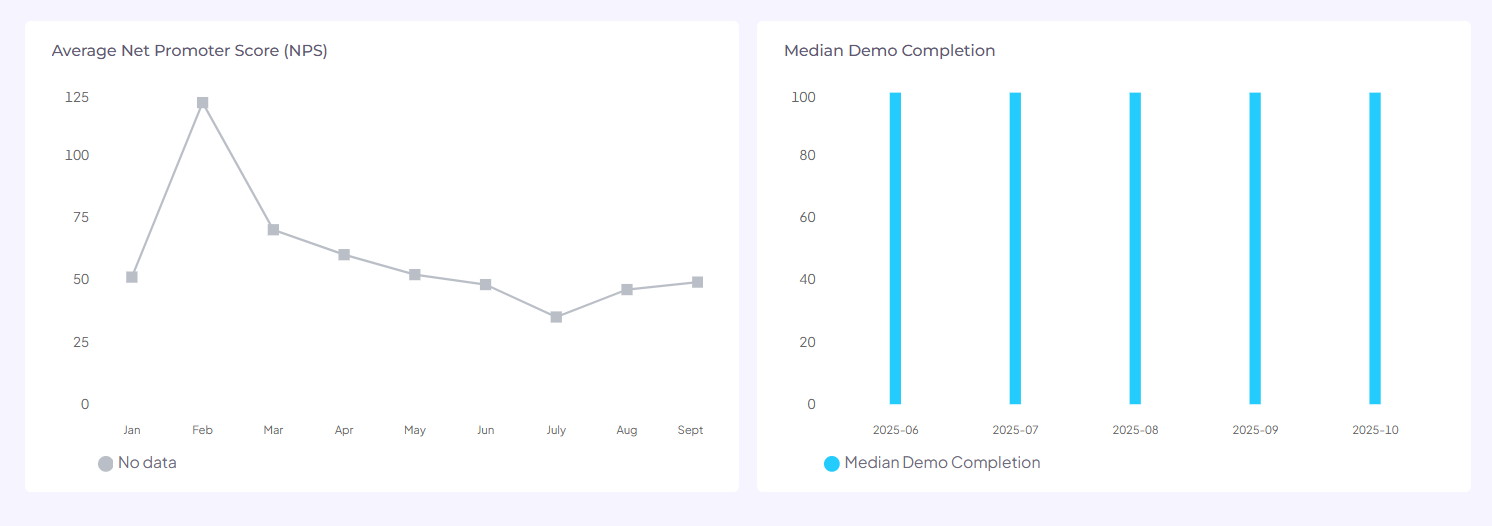
Below these critical statistics, you can view the same data visualized in clear, easy-to-read graphs, allowing you to quickly spot trends and performance fluctuations. You can also use the available Filtering options just below the navigation tabs to focus your analysis on specific timeframes.
Step 3: The most granular data available is found within the Sessions view. A Session represents a single instance of a user viewing your demo, capturing all the details surrounding that interaction.
By drilling down into Sessions, you gain visibility into:
- Individual Viewer Behavior: See exactly which steps each lead completed, where they spent the most time, and where they exited the demo.
- Lead Identification: When integrated with forms or variables, sessions link the viewing activity back to a specific lead or prospect.
- Data Export: The sessions view is the source for your raw data. You can easily Export this entire dataset into a widely-compatible CSV format. This allows you to import the data into external tools like Google Sheets or other BI platforms for advanced aggregation, manipulation, and custom visualization, ensuring maximum compatibility with your existing tech stack.
In addition to the analytics available on the platform - if you're using a lead form and want to send captured data to your favorite CRM, email marketing tool, or internal communication channels for further analysis on your end - setting up a webhook via Zapier does the job in real time. Check out the full article: How to Integrate Demoboost Lead Forms with Webhooks via Zapier?