
.png)
Learn how presales is evolving and howyour team can stay ahead in atech-driven sales landscape.

.webp)
Demo analytics shows how buyers engage with your interactive product demos: which demos they open, how far they get, where they spend time, where they drop off, and whether they come back or share the demo with colleagues. For sales and presales teams, this turns every demo into a product-level intent signal you can act on before, during, and after the sales conversation.
This matters because most teams still walk into discovery calls blind. They fall back on generic question checklists and hope something lands. Demo analytics replaces that guesswork with evidence. In this post, we will cover the metrics worth tracking, how to read individual session data, and five practical ways to use demo engagement data in your sales process.
Demo analytics is the data layer behind your interactive product demos. Instead of sharing a demo link and hoping for the best, you can see exactly what happened after you hit send.
In Demoboost, analytics works at two levels:
Together, these answer two different questions. Per-demo analytics tells you whether your content works. Session data tells you what each specific buyer cares about.
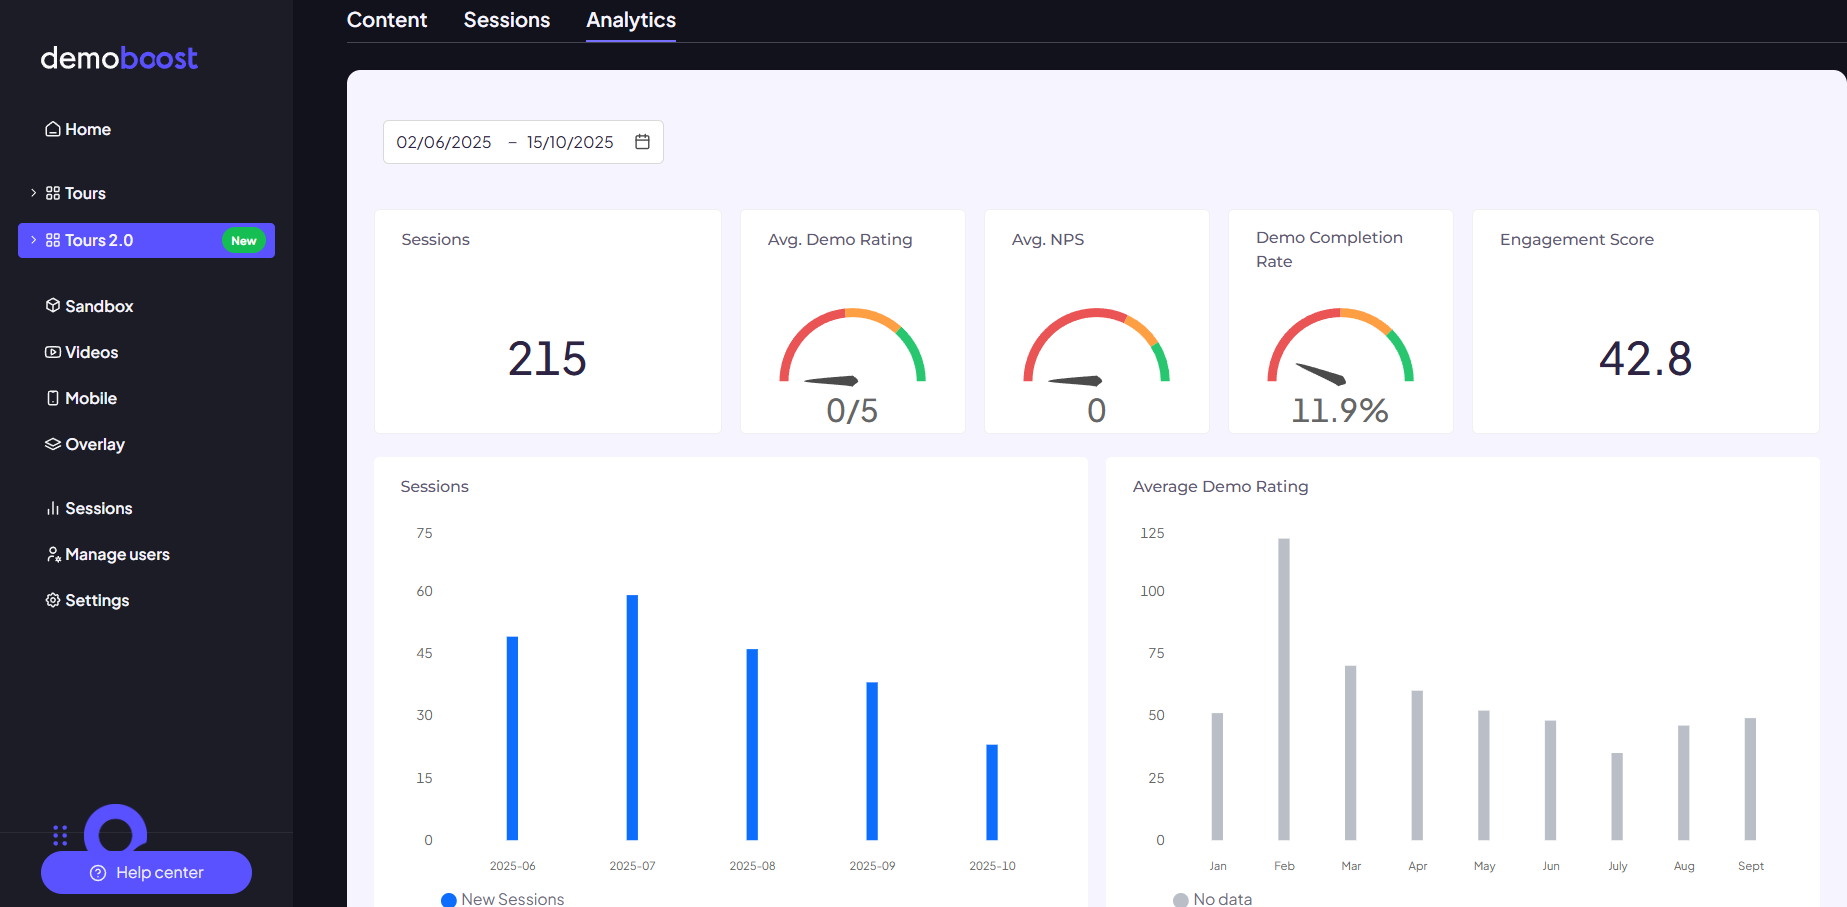
Demoboost surfaces five summary metrics for every demo. Each one answers a different question about performance.
Sessions. The total number of times the demo was started or viewed. This measures reach and usage. A spike in sessions on a shared demo often means your champion is circulating it internally, which is a buying signal in itself.
Demo completion rate. The average percentage of the demo that viewers navigated through before stopping. A low completion rate tells you where the story loses people. Find the drop-off point and either fix the content or prepare to address that section live on the call.
Engagement score. An aggregate measure of how actively viewers interacted with your demo content. It separates a lead who clicked through in 40 seconds from one who genuinely explored.
Average demo rating. The average 1 to 5 score viewers leave in the feedback form. Compare your highest and lowest rated demos to understand what differentiates content that lands from content that does not.
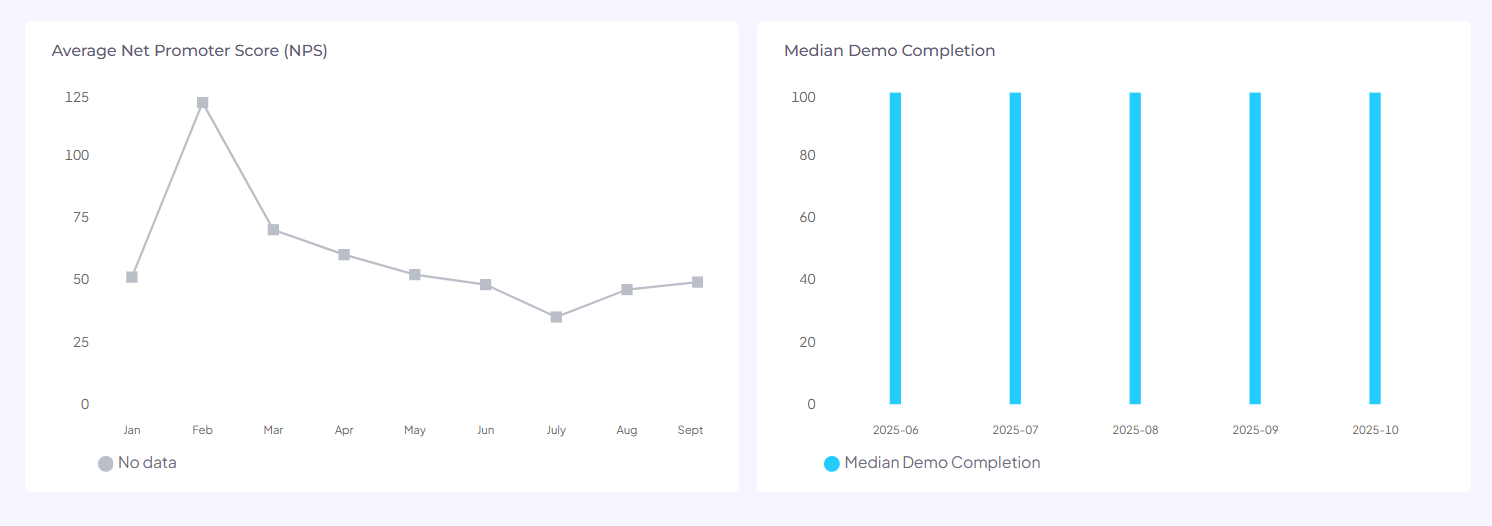
Average NPS. The average answer to "How likely are you to recommend this product to others." It is an early read on advocacy potential, before anyone has signed anything. For context, demos built on Demoboost average an NPS of 89 across the platform.
You can filter all of this by timeframe and view the trends in graphs, which makes it easy to spot whether a content change actually moved the numbers.
Aggregate data is most useful for improving the demo library itself. A few patterns to watch:
This is also where demo governance starts to matter. Once you know which demos perform, you can promote those into your standard library and retire the ones that quietly lose deals.
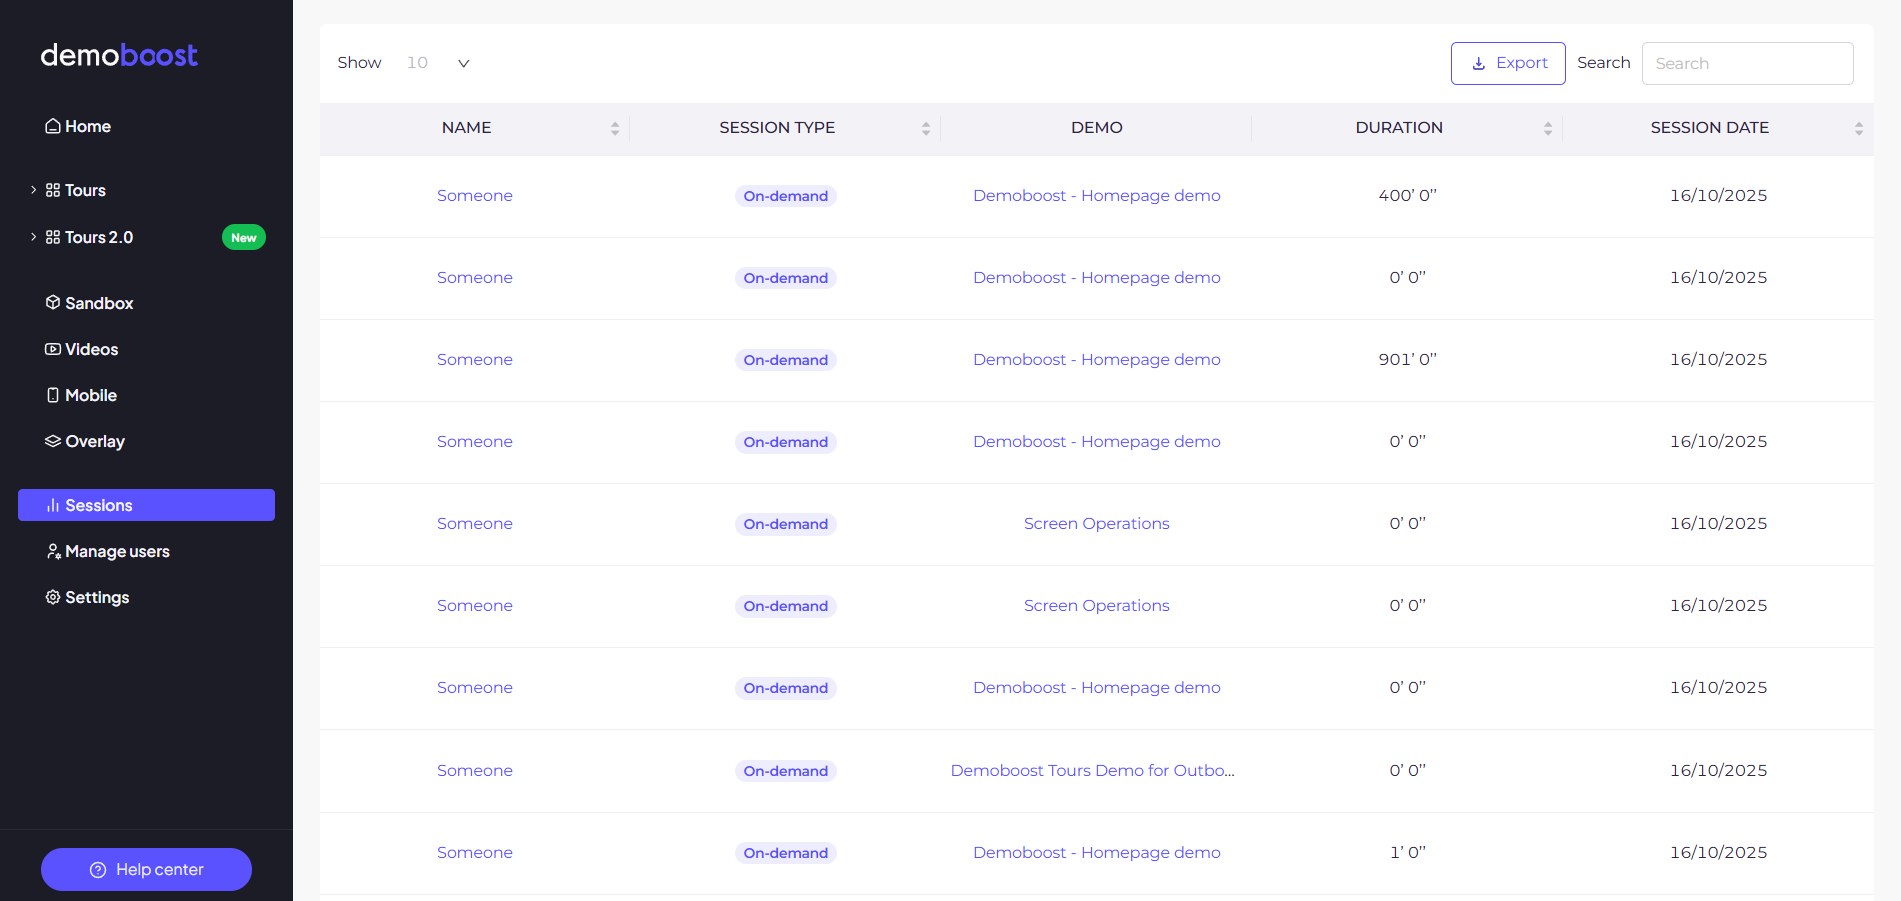
Session-level data is where demo analytics becomes a selling tool rather than a content tool. Each session captures a single viewing event and links it back to a specific lead when you use lead forms or variables.
Here is how to read the key signals:
All session data can be exported to CSV, so RevOps and analytics teams can pull it into Google Sheets or BI tools alongside the rest of their pipeline data.
There is nothing more uncomfortable for a salesperson than walking into a discovery call with nothing but a MEDDIC checklist. It feels like an interrogation to the prospect, and it adds no value to the conversation.
Demo engagement data fixes that. Five ways to put it to work:
1. Lead with your proven demos. If one demo consistently shows high views and completion rates, it is hitting the mark. Bring its content into your pitch and reference it in discovery calls.
2. Let engagement data guide your discovery questions. If a lead spent most of their time on a specific workflow, open the conversation there. Ask pointed questions about that topic instead of running through a generic script. You already know what they care about. Use it.
3. Fix confusion before it costs you. Encourage viewers to ask questions through demo comments. Recurring questions on the same step mean the messaging is not clear. Improve it, then watch whether the questions stop.
4. Prepare for the drop-off points. If buyers consistently exit at one point in the demo, prepare to address that section live, or restructure the demo around your more engaging features.
5. Map the buying committee. When a prospect shares a demo, they are championing it internally. Demoboost's stakeholder mapping shows who else is engaging, which helps you identify the real buying committee early and ask about the new stakeholders on your next call instead of discovering them at contract stage.
The result is a discovery call built around what the prospect has already shown you they care about. That is a value-driven conversation, not an interrogation.
Demo engagement data is most useful when it lives where your revenue team already works. Demoboost connects to your CRM and the rest of your stack through Zapier.
The trigger is a lead form submission inside a demo. When a buyer fills in a lead form, that event can start a Zap that:
Because the connection runs through Zapier, you are not limited to one CRM. If a tool is on Zapier, Demoboost lead data can reach it.
For deeper analysis, all session data exports to CSV, so RevOps and analytics teams can pull demo engagement into Google Sheets or BI tools alongside the rest of their pipeline data.
The engagement signal is worth capturing. GuideCX, a client onboarding software company, saw website engagement increase 10X after adding Demoboost guided tours, per Chris Haleua, VP of Product and Marketing at GuideCX. Routing that activity into your systems through Zapier is what turns a demo view into a lead, a follow-up trigger, and a scoring input rather than a stat in a separate dashboard.
This is also where demo analytics is heading as a category. Knowing a demo was viewed is table stakes. The next step is connecting demo engagement to leads, accounts, opportunities, and buying committees, so demo activity becomes a first-class signal in your revenue workflows rather than something you stitch together after the fact.
Demo analytics gives sales and presales teams something the traditional demo motion never offered: visibility into what happens after the demo. Aggregate metrics tell you which content works. Session data tells you what each buyer cares about. Together, they turn discovery calls into informed, specific conversations and turn every demo into a reusable, trackable buying asset rather than something that disappears after the meeting.
The days of generic sales pitches are over.
What is demo analytics?
Demo analytics is data on how buyers engage with interactive product demos, including views, sessions, completion rates, time spent per step, drop-off points, ratings, and sharing behavior. Sales and presales teams use it to qualify interest and personalize follow-up.
What metrics does Demoboost track for each demo?
Demoboost provides five summary metrics per demo: sessions, demo completion rate, engagement score, average demo rating, and average NPS. Each demo also has session-level data showing individual viewer behavior step by step.
Can demo analytics identify individual leads?
Yes. When demos use lead forms or variables, each viewing session links back to a specific lead, so you can see exactly which prospect viewed what, for how long, and where they stopped.
How do sales teams use demo analytics in discovery calls?
Engagement data shows which use cases a prospect explored most, so sellers can open the conversation on topics the buyer has already shown interest in, instead of running a generic question checklist.
Can I export demo analytics data?
Yes. The Sessions view exports to CSV, which you can load into Google Sheets or BI tools for custom analysis alongside your pipeline data.
Does demo engagement data connect to my CRM?
Yes, through Zapier. When a buyer submits a lead form in a demo, that event can trigger a Zap that creates or updates records in Salesforce or HubSpot, and the same trigger can route the lead to Slack, email, or any other Zapier-connected tool. Session data also exports to CSV for BI tools.
What is a good demo completion rate?
It depends on demo length and audience, but as a reference point, the median demo completion rate across the Demoboost platform is 88%. The more useful exercise is comparing completion rates across your own demos to find which structures and lengths keep buyers engaged.
Book a live demo to see how Demoboost helps your team cut demo prep time, qualify buyers faster, and focus on real opportunities.
Book a Live Demo

.png)
.png)
